Monitoring and Handling Throttling in Microservices Applications within the Kubernetes Cluster
Blogs

SQL Server Security Features
August 13, 2023
Configuring DSN with ODBC Driver and Automating Tasks with PowerShell
September 3, 2023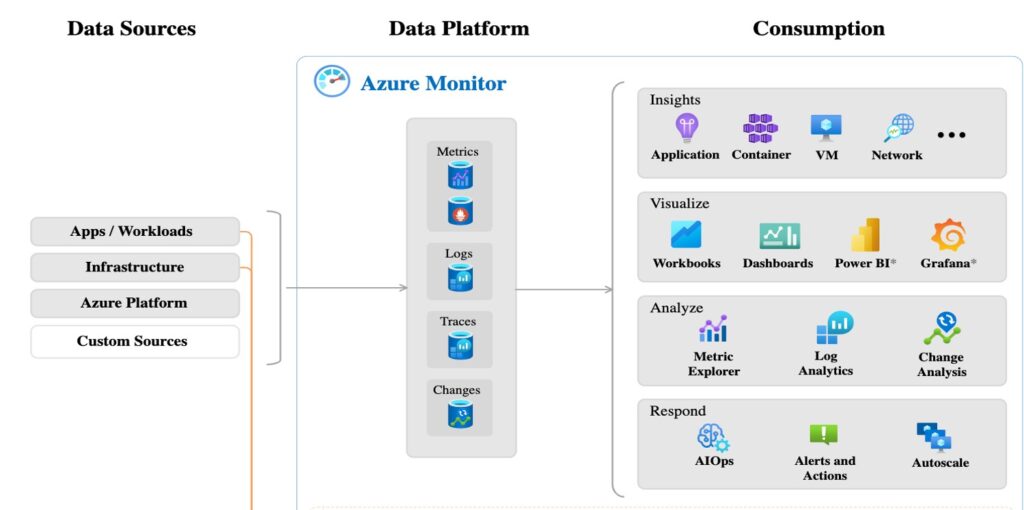
Within the realm of application development, it is imperative to establish robust procedures for managing API call logs and upholding observability. These measures are crucial for the efficient oversight of microservices functioning within a Kubernetes cluster. Following the application’s inception, vigilant monitoring of service health emerges as a paramount requirement to ensure seamless and optimal operations.
Azure Monitor provides a comprehensive monitoring solution for AKS. It offers insights into the application’s performance, availability, and issues. Azure Monitor can collect and analyse logs, metrics, and traces generated by the microservice’s application. It also provides alerts, dashboards, and visualisations for better understanding of the application’s behaviour and troubleshooting problems.
Telemetry Logging Infrastructure:
Within the Azure Kubernetes framework, comprehensive telemetry data encompassing logs, traces, and metrics can be harnessed to facilitate the monitoring of application behaviour.
Logs: These record data and serve as an archival of events transpiring within a functional application, presented in a textual format. They encompass both application-specific logs and logs originating from the web server.
Traces: This facet pertains to the systematic documentation of executed operations. It meticulously documents the sequence of transactions associated with a singular request, capturing a comprehensive spectrum of information from the initiation point in the user interface to the culmination at the network service level.
Spans: In the context of traces, spans emerge as elemental units of activity. Each span is intrinsically linked with individual traces, and notably, these spans often encapsulate nested spans. Furthermore, spans extend their utility by proficiently documenting outgoing interactions between distinct services, thereby fulfilling the role of dependency records.
Metrics Collection: Metrics are essential for monitoring the health and performance of microservices. At the cluster, container, and application insight levels, it can be gathered. Controllers, nodes, and containers are utilised to gather cluster and container level memory processor metrics using the Kubernetes Metrics API. Metrics at application-level are gathered via instrumental packages which gathers host environment data in addition to monitoring telemetry data from application insights.
AKS integrates with Azure Monitor, enabled to gather metrics at different levels:
- Node-level metrics: tracks CPU, memory, disk, network usage of the cluster nodes, which aid in resource allocation and trouble shooting in clusters.
- Container metrics: Resource usage within individual containers.
- Application metrics: Custom metrics specific to the application, such as request counts, latencies, and other business-specific metrics.
- Dependent service metrics: Metrics related to external services that the application interacts with, insights should be recorded from application end, cannot rely on external/3rd party services.
Instrumentation:
To collect API call logs, it is essential to incorporate instrumentation into your application code. This entails inserting logging statements, often referred to as trace statements, at pertinent junctures within your microservices codebase. The result of these actions is the generation of log entries, which hold pertinent details regarding the application’s conduct. These encompass aspects such as request processing, error occurrences, and other notable events.
Single operation generates multiple telemetry events, if the data rate exceeds the maximum limit it leads to throttling and high-volume traffic in application and as application insights are batch data, there is possibility of data loss.
Structured Logging:
Structured logging is recommended, as it ensures that logs are consistent and can be easily parsed by logging tools. Log entries should include key information like timestamps, severity levels, request IDs, operation names, and any relevant contextual data. This structured approach makes it easier to search, filter, and analyse logs.
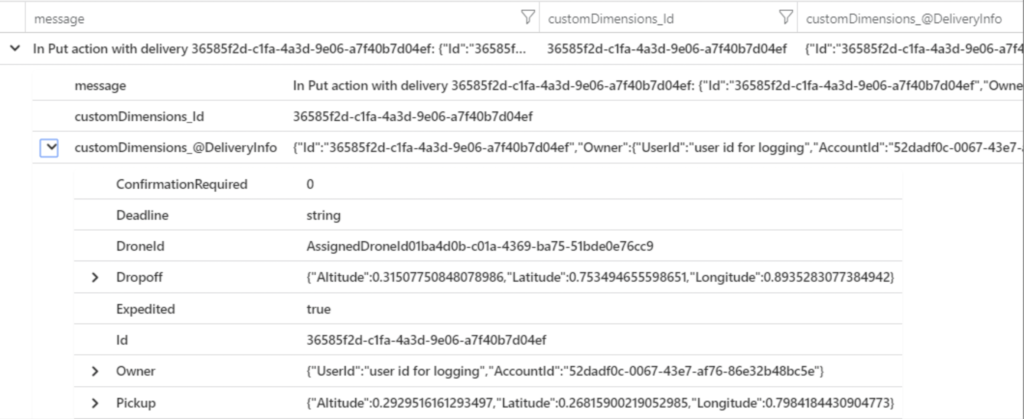
The above diagram, illustrates the structured logs with key and value.
{

"Id": "36585f2d-c1fa-4a3d-9e06-a7f40b7d04ef",

"Owner": {

"UserId": "user id for logging",

"AccountId": "52dadf0c-0067-43e7-af76-86e32b48bc5e"

},

"Pickup": {

"Altitude": 0.29295161612934972,

"Latitude": 0.26815900219052985,

"Longitude": 0.79841844309047727

},

"Dropoff": {

"Altitude": 0.31507750848078986,

"Latitude": 0.753494655598651,

"Longitude": 0.89352830773849423

},

"Deadline": "string",

"Expedited": true,

"ConfirmationRequired": 0,

"DroneId": "AssignedDroneId01ba4d0b-c01a-4369-ba75-51bde0e76cc9"

}
Distributed Tracing:
Distributed tracing is essential in microservices architectures to trace the flow of requests across different services. It provides insights into how requests propagate through the application and helps identify performance bottlenecks and issues. Spans represent individual units of work within a trace and help visualize the path of a request through different microservices.
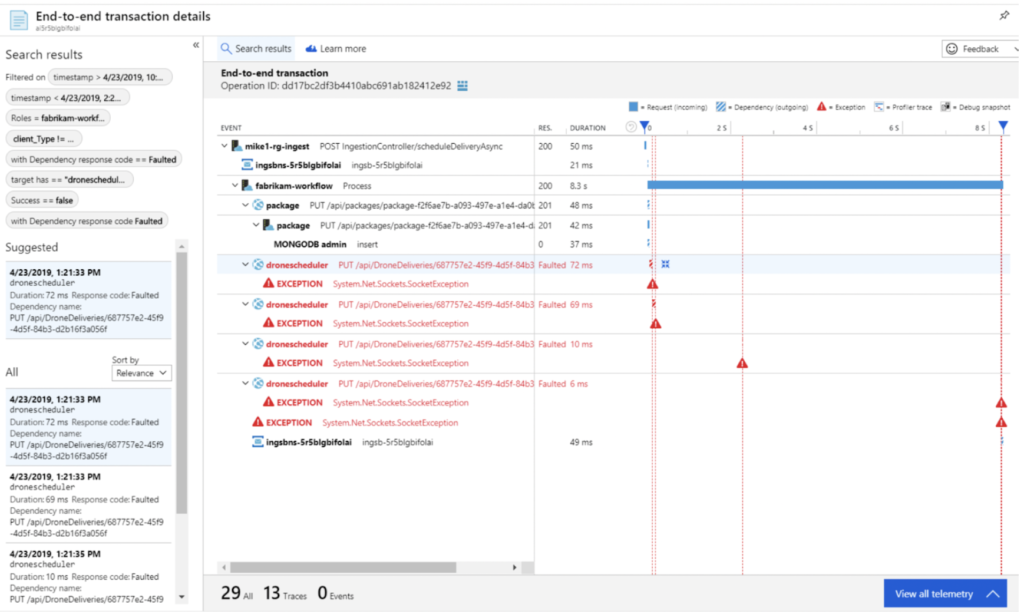
The above diagram illustrates distributed logging of a transaction.
Alerting and Visualisation:
Setting up alerts based on specific log patterns or metric thresholds is crucial for proactive monitoring. Azure Monitor can trigger alerts when certain conditions are met, helps detect and respond to issues promptly. Dashboards and visualizations enable you to monitor key performance indicators and track the overall health of microservices applications.
In summary, handling API call logs in Azure Kubernetes Service involves instrumenting application with structured logging, utilizing distributed tracing for request tracking, collecting metrics at various levels of the application and infrastructure, integrating with Azure Monitor, and using alerts and visualizations to ensure effective monitoring and troubleshooting of the microservice’s application.
Poornima.n